- Published on
Binary Classification of Insurance Cross Selling
Summary of week 1 during my joint summer internship @ systex & google: The first part of my summer internship will be based at Systex (精誠資訊) with a focus on AI tools and application in the medical field. In the first week, I refreshed my knowledge on python and AI (supervised training) by starting a contest on Kaggle.
The goal of this competition is given a dataset, predict which customers respond positively to an automobile insurance offer. The dataset for this contest is around 11 million lines long.
EDA
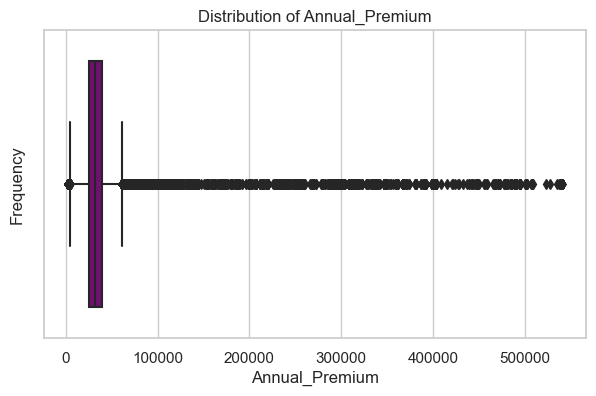
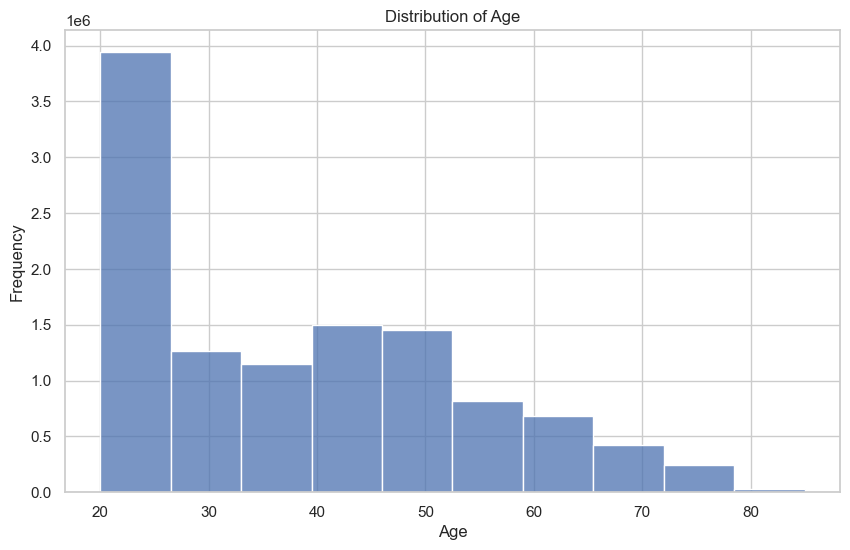
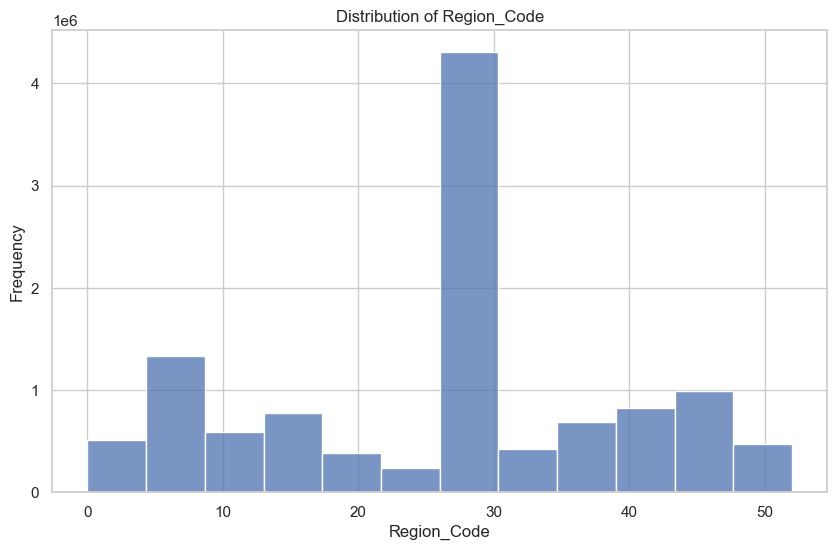
EDA stands for exploratory data analysis. Essentally before the process of modifying our data / train the model, we want to know certain values about our dataset, such as its shape, distributions of certain features etc.. This will help with feature engineering and gives me a better idea of what the data I'm working with look like.
Checking for Inbalanced Results
Output:
0    10089739
1     1415059
Name: Response, dtype: int64
0    10089739
1    10089739
Name: Response, dtype: int64
As we can see, in our training data, there is an overwhelming amount of 0 values over 1. This can cause biases for the model, so we use SMOTE to generate samples to counteract the inbalance.
Feature Selection
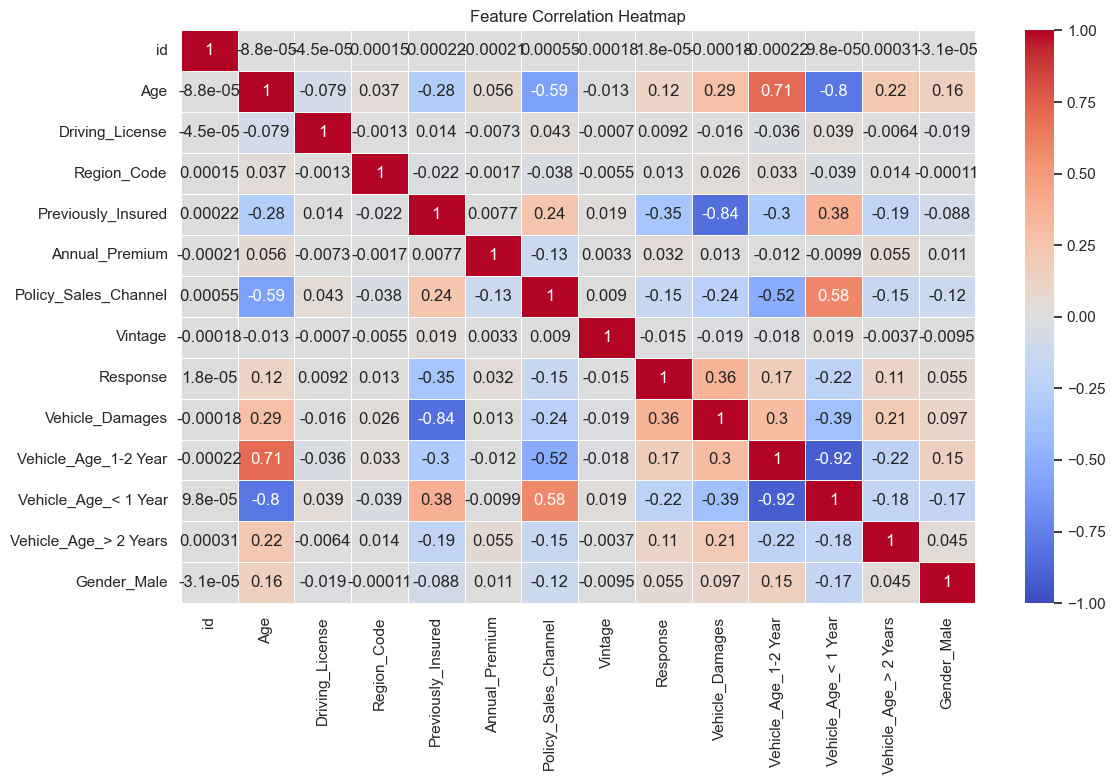
By looking at the correlation matrix, we can drop features such as Driving License because it has little to no correlation (p < 0.05) to our target feature (Response).
We also want to transform categorical data such as Gender into 0 and 1s, so the model can process them.
Preprocessing Data
We use sklearn's StandardScaler feature to help us "standardize features by removing the mean and scaling to unit variance".
It normalizes each feature / column with the following formula such that each column has μ = 0 and σ = 1.
Training the model
For the first attempt, I used a LogisticRegression coupled with a grid search for hyperparameter optimization. In reality, I think catboost or XGBoost would work better but I wanted to try something new (and I have to know all of them anyways).
Output:
accuracy_score: 79.37472455517519
precision_score: 0.7531891271754535
recall_score: 0.873758637005239
roc_auc_score: 0.8802292451252265

confusion_matrix:
array([[2160781,  866551],
       [ 382071, 2644441]], dtype=int64)
Here the AUC score is quite high in my opinion, but in reality when tested against the entire test data on Kaggle, it is not that high, suggesting the possibility of overfitting or other biases. The confusion matrix also shows that there are a lot of false positives (866551).
First submission:
Other tools
The plan for week 2 is to continue doing this contest, but alongside other tasks. Probably going to try a different model such as catboost and see if I can improve the score. Overall it's been a fruitful week and I've learned a lot on the non-technical side too, joining in meetings and making new connections.
These are some new tools that I was made aware of this week, thanks to my mentor:
LightAutoML for tabular data training
This for finding feature importance on a logistic regression
Optuna for hyperparameter optimization
Shap for feature engineering and analysis